Launch App
Launch App

AI-Powered Trading Assistant

1,000+

Supported Coins

400

Strategy

10

Timeframes

Spot, Future

Markets

Nexcrypto AI-Powered Trading Assistant

Will Provide Features More Than You Expect!

NexCrypto is one of the best trading assistant tools which gives you all you need to analyze all the market with full respect to price action methodologies and all other indicators. This artificial intelligence system scans and analyze all the crypto market in each timeframe and gives you the best results you ever imagine.

Real-Time Monitoring

NexCrypto AI System monitors the whole crypto market,24/7. NexCrypto trading assistant will notify you of purchasing opportunities based on common and advanced technical methodologies such as price action, indicators and oscillators

Utilizing Strategies

The trading assistant of NexCrypto will examine real time trading opportunities, including Price action methods,Ichimoku, RSI, MACD, and more than four hundred strategies

Remote Notifications

Enable e-mail on Nexcrypto to get notified instantly of new potential trading opportunities in the financial markets

Simple And Easy To Use

Nexcrypto makes advanced trading as easy as ABCs; with Nexcrypto all the important remarks are available at your fingertips at the earliest released point

Easy Customization
Easy Customization

Nexcrypto Trading Assistant gives too many options in coins/stocks or strategies so you can select and customize the ones you want

Easy Customization
Grab Chances

Be among the first in the world to get notified when coins display trading opportunities.

Nexcrypto Academy

+300 Articles to Study More About Trading Strategies
and Learn More About CryptoCurrency Projects.
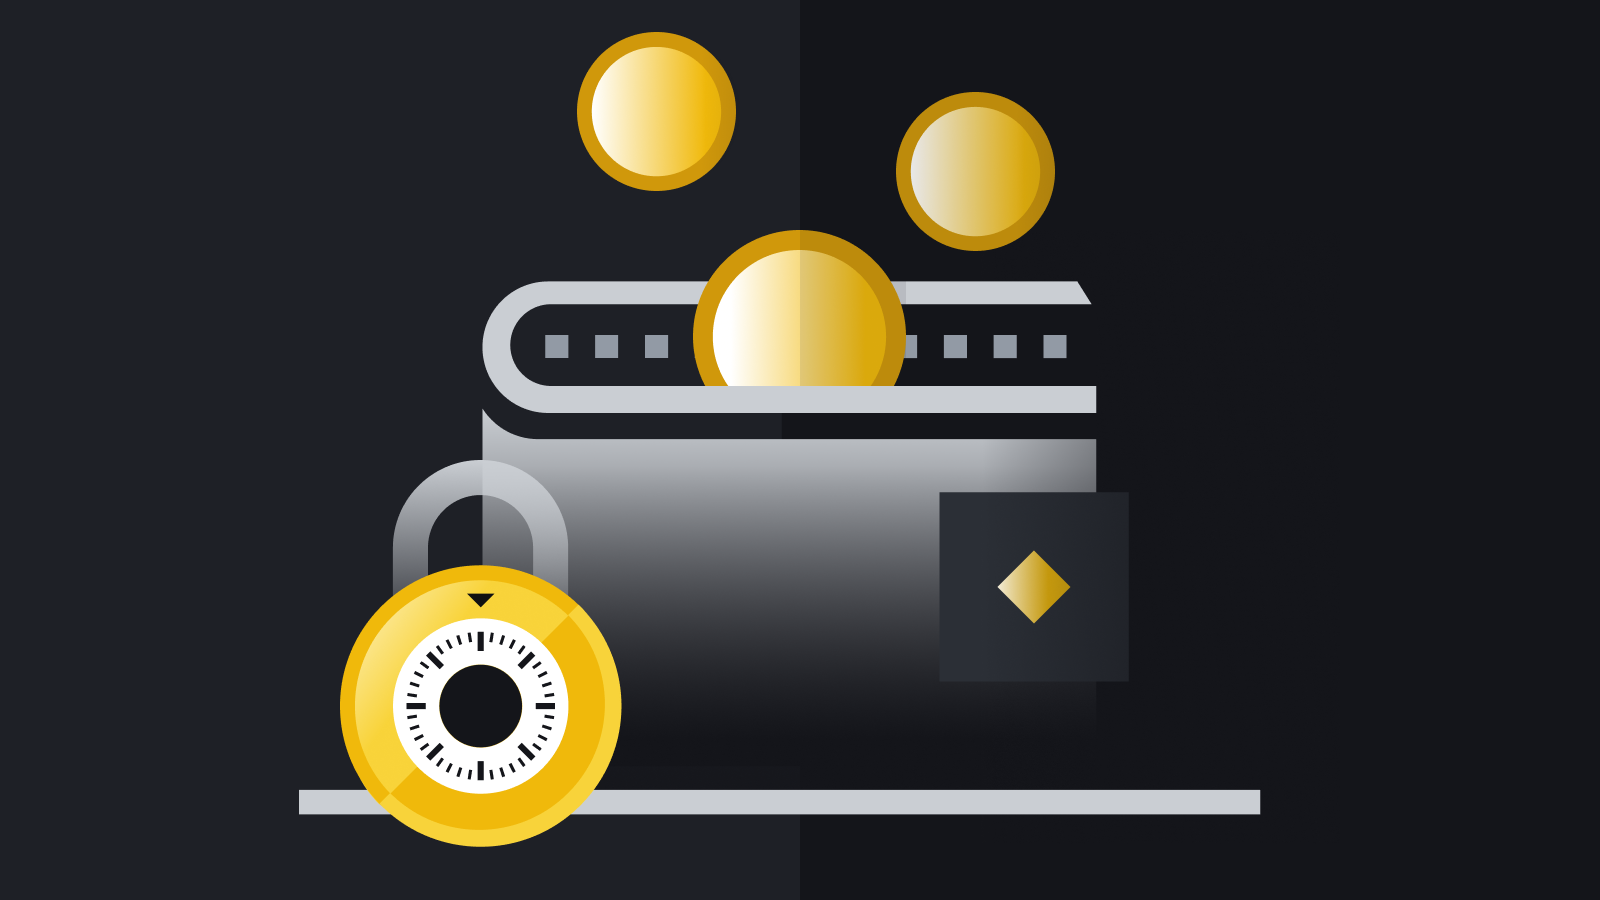
Show More Article

What is trading assistant ?

The main issue is why do we call Nexcrypto artificial intelligence system as a trading assistant. As a general definition, Trading assistants perform a range of support tasks to assist a financial trader.
Nexcrypto as an AI system, do the same 24/7 every 5 minutes on all market symbols! It observes all the market and took every symbol's price data and put all known technical strategies and methodologies on each symbol, then save them separately for future studies by system users. So you could easily combine any familiar strategy which suits your trading and entry setup together to gain more success through your trading journey.
Read More

Nexcrypto Vs. charting systems such as Tradingview

Analytic systems like Tradingview are charting platforms which provide price changes analysis over chart by pushing some indicators and oscillators. So if you work on Price Action methodology or Harmonic Pattern & ... it could not automatically handle your request and you should work manually on each symbol which took huge time!
Nexcrypto artificial intelligence system work as full time analyst team for you! It analyzes whole market by over 400 strategies and notify the results whenever you want. Although for charting the result it took help from Tradingview libraries. So there is no need to waste time for analytics. You could concentrate on other sides of trading procedure such as risk management etc.
Read More

1/3

Strategies and Indicators We Support

Trend-following
Price Action
Oscillator
Price Ratio
ICT

Ichimoku

Price Crosses Up Kumo
trend-following BUY
Price Above Kumo
trend-following BUY
Price Crosses Up Base
trend-following BUY
Price Above Base
trend-following BUY
Price Crosses Up Conversion
trend-following BUY
Price Above Conversion
trend-following BUY
Conversion Crosses Up Base
trend-following BUY
Conversion Above Base
trend-following BUY
Price Pullback From Above Kumo
trend-following BUY
Price Pullback From Above Base
trend-following BUY
Price Pullback From Above Conversion
trend-following BUY
Lagging Crosses Up Price
trend-following BUY
Lagging Above Price
trend-following BUY
Lead1 Crosses Up Lead2
trend-following BUY
Lead1 Above Lead2
trend-following BUY
Price Crosses Down Kumo
trend-following SELL
Price Below Kumo
trend-following SELL
Price Crosses Down Base
trend-following SELL
Price Below Base
trend-following SELL
Price Crosses Down Conversion
trend-following SELL
Price Below Conversion
trend-following SELL
Conversion Crosses Down Base
trend-following SELL
Conversion Below Base
trend-following SELL
Price Pullback From Below Kumo
trend-following SELL
Price Pullback From Below Base
trend-following SELL
Price Pullback From Below Conversion
trend-following SELL
Lagging Crosses Down Price
trend-following SELL
Lagging Below Price
trend-following SELL
Lead1 Crosses Down Lead2
trend-following SELL
Lead1 Below Lead2
trend-following SELL

SMA

Price Crosses Up SMA10
trend-following BUY
Price Above SMA10
trend-following BUY
Price Crosses Up SMA20
trend-following BUY
Price Above SMA20
trend-following BUY
Price Crosses Up SMA50
trend-following BUY
Price Above SMA50
trend-following BUY
Price Crosses Up SMA100
trend-following BUY
Price Above SMA100
trend-following BUY
Price Crosses Up SMA200
trend-following BUY
Price Above SMA200
trend-following BUY
Price Pullback From Above Sma10
trend-following BUY
Price Pullback From Above Sma20
trend-following BUY
Price Pullback From Above Sma50
trend-following BUY
Price Pullback From Above Sma100
trend-following BUY
Price Pullback From Above Sma200
trend-following BUY
Price Crosses Down SMA10
trend-following SELL
Price Below SMA10
trend-following SELL
Price Crosses Down SMA20
trend-following SELL
Price Below SMA20
trend-following SELL
Price Crosses Down SMA50
trend-following SELL
Price Below SMA50
trend-following SELL
Price Crosses Down SMA100
trend-following SELL
Price Below SMA100
trend-following SELL
Price Crosses Down SMA200
trend-following SELL
Price Below SMA200
trend-following SELL
Price Pullback From Below Sma10
trend-following SELL
Price Pullback From Below Sma20
trend-following SELL
Price Pullback From Below Sma50
trend-following SELL
Price Pullback From Below Sma100
trend-following SELL
Price Pullback From Below Sma200
trend-following SELL

WMA

Price Crosses Up WMA10
trend-following BUY
Price Above WMA10
trend-following BUY
Price Crosses Up WMA20
trend-following BUY
Price Above WMA20
trend-following BUY
Price Crosses Up WMA50
trend-following BUY
Price Above WMA50
trend-following BUY
Price Crosses Up WMA100
trend-following BUY
Price Above WMA100
trend-following BUY
Price Crosses Up WMA200
trend-following BUY
Price Above WMA200
trend-following BUY
Price Pullback From Above Wma10
trend-following BUY
Price Pullback From Above Wma20
trend-following BUY
Price Pullback From Above Wma50
trend-following BUY
Price Pullback From Above Wma100
trend-following BUY
Price Pullback From Above Wma200
trend-following BUY
Price Crosses Down WMA10
trend-following SELL
Price Below WMA10
trend-following SELL
Price Crosses Down WMA20
trend-following SELL
Price Below WMA20
trend-following SELL
Price Crosses Down WMA50
trend-following SELL
Price Below WMA50
trend-following SELL
Price Crosses Down WMA100
trend-following SELL
Price Below WMA100
trend-following SELL
Price Crosses Down WMA200
trend-following SELL
Price Below WMA200
trend-following SELL
Price Pullback From Below Wma10
trend-following SELL
Price Pullback From Below Wma20
trend-following SELL
Price Pullback From Below Wma50
trend-following SELL
Price Pullback From Below Wma100
trend-following SELL
Price Pullback From Below Wma200
trend-following SELL

EMA

Price Crosses Up EMA10
trend-following BUY
Price Above EMA10
trend-following BUY
Price Crosses Up EMA20
trend-following BUY
Price Above EMA20
trend-following BUY
Price Crosses Up EMA50
trend-following BUY
Price Above EMA50
trend-following BUY
Price Crosses Up EMA100
trend-following BUY
Price Above EMA100
trend-following BUY
Price Crosses Up EMA200
trend-following BUY
Price Above EMA200
trend-following BUY
Price Pullback From Above Ema10
trend-following BUY
Price Pullback From Above Ema20
trend-following BUY
Price Pullback From Above Ema50
trend-following BUY
Price Pullback From Above Ema100
trend-following BUY
Price Pullback From Above Ema200
trend-following BUY
Price Crosses Down EMA10
trend-following SELL
Price Below EMA10
trend-following SELL
Price Crosses Down EMA20
trend-following SELL
Price Below EMA20
trend-following SELL
Price Crosses Down EMA50
trend-following SELL
Price Below EMA50
trend-following SELL
Price Crosses Down EMA100
trend-following SELL
Price Below EMA100
trend-following SELL
Price Crosses Down EMA200
trend-following SELL
Price Below EMA200
trend-following SELL
Price Pullback From Below Ema10
trend-following SELL
Price Pullback From Below Ema20
trend-following SELL
Price Pullback From Below Ema50
trend-following SELL
Price Pullback From Below Ema100
trend-following SELL
Price Pullback From Below Ema200
trend-following SELL

SMA-Crossover

SMA10 Crosses Up SMA20
trend-following BUY
SMA10 Above SMA20
trend-following BUY
SMA20 Crosses Up SMA50
trend-following BUY
SMA20 Above SMA50
trend-following BUY
SMA50 Crosses Up SMA100
trend-following BUY
SMA50 Above SMA100
trend-following BUY
SMA100 Crosses Up SMA200
trend-following BUY
SMA100 Above SMA200
trend-following BUY
Sma50 Crosses Up Sma200
trend-following BUY
Sma50 Above Sma200
trend-following BUY
SMA10 Crosses Down SMA20
trend-following SELL
SMA10 Below SMA20
trend-following SELL
SMA20 Crosses Down SMA50
trend-following SELL
SMA20 Below SMA50
trend-following SELL
SMA50 Crosses Down SMA100
trend-following SELL
SMA50 Below SMA100
trend-following SELL
SMA100 Crosses Down SMA200
trend-following SELL
SMA100 Below SMA200
trend-following SELL
Sma50 Crosses Down Sma200
trend-following SELL
Sma50 Below Sma200
trend-following SELL

WMA-Crossover

WMA10 Crosses Up WMA20
trend-following BUY
WMA10 Above WMA20
trend-following BUY
WMA20 Crosses Up WMA50
trend-following BUY
WMA20 Above WMA50
trend-following BUY
WMA50 Crosses Up WMA100
trend-following BUY
WMA50 Above WMA100
trend-following BUY
WMA100 Crosses Up WMA200
trend-following BUY
WMA100 Above WMA200
trend-following BUY
WMA50 Crosses Up WMA200
trend-following BUY
WMA50 Above WMA200
trend-following BUY
WMA10 Crosses Down WMA20
trend-following SELL
WMA10 Below WMA20
trend-following SELL
WMA20 Crosses Down WMA50
trend-following SELL
WMA20 Below WMA50
trend-following SELL
WMA50 Crosses Down WMA100
trend-following SELL
WMA50 Below WMA100
trend-following SELL
WMA100 Crosses Down WMA200
trend-following SELL
WMA100 Below WMA200
trend-following SELL
WMA50 Crosses Down WMA200
trend-following SELL
WMA50 Below WMA200
trend-following SELL

EMA Crossover

EMA10 Crosses Up EMA20
trend-following BUY
EMA10 Above EMA20
trend-following BUY
EMA20 Crosses Up EMA50
trend-following BUY
EMA20 Above EMA50
trend-following BUY
EMA50 Crosses Up EMA100
trend-following BUY
EMA50 Above EMA100
trend-following BUY
EMA100 Crosses Up EMA200
trend-following BUY
EMA100 Above EMA200
trend-following BUY
Ema50 Crosses Up Ema200
trend-following BUY
Ema50 Above Ema200
trend-following BUY
EMA10 Crosses Down EMA20
trend-following SELL
EMA10 Below EMA20
trend-following SELL
EMA20 Crosses Down EMA50
trend-following SELL
EMA20 Below EMA50
trend-following SELL
EMA50 Crosses Down EMA100
trend-following SELL
EMA50 Below EMA100
trend-following SELL
EMA100 Crosses Down EMA200
trend-following SELL
EMA100 Below EMA200
trend-following SELL
Ema50 Crosses Down Ema200
trend-following SELL
Ema50 Below Ema200
trend-following SELL

Candlestick-Patterns

Hammer Pattern
price action BUY
Inverted Hammer Pattern
price action BUY
Bullish Harami Pattern
price action BUY
Bullish Marubozu Pattern
price action BUY
Three White Soldiers Pattern
price action BUY
Three Rising Methods Pattern
price action BUY
Morning Star Pattern
price action BUY
Dragonfly Doji Pattern
price action BUY
Bullish Engulfing Pattern
price action BUY
Morning Star Doji Pattern
price action BUY
Bullish Kicker Pattern
price action BUY
Piercing Pattern
price action BUY
Hanging Man Pattern
price action SELL
Bearish Harami Pattern
price action SELL
Bearish Marubozu Pattern
price action SELL
Three Black Crows Pattern
price action SELL
Three Falling Methods Pattern
price action SELL
Shooting Star Pattern
price action SELL
Evening Star Pattern
price action SELL
Gravestone Doji Pattern
price action SELL
Bearish Engulfing Pattern
price action SELL
Evening Star Doji Pattern
price action SELL
Bearish Kicker Pattern
price action SELL
Dark Cloud Cover
price action SELL

Special Pattern

Double Bottom
price action BUY
Bullish Three Push
price action BUY
Bullish Entry Price
price action BUY
Price Above Bullish Entry Price
price action BUY
Bullish Head And Shoulder
price action BUY
Bullish Quasimodo Pattern
price action BUY
Double Top
price action SELL
Bearish Three Push
price action SELL
Bearish Entry Price
price action SELL
Price Below Bearish Entry Price
price action SELL
Bearish Head And Shoulder
price action SELL
Bearish Quasimodo Pattern
price action SELL

Support/Resistance Zone

Price Crosses Up Resistance Zone
price action BUY
Price Inside Support Zone
price action BUY
Price Above Resistance Zone
price action BUY
Price Pullback Resistance Zone
price action BUY
Price Above Support Zone
price action BUY
Price Crosses Down Support Zone
price action SELL
Price Inside Resistant Zone
price action SELL
Price Below Support Zone
price action SELL
Price Pullback Support Zone
price action SELL
Price Below Resistance Zone
price action SELL

Trading Range

Price Near Trading Range Lower Zone
price action BUY
Price Near Trading Range Upper Zone
price action SELL

Gap (change Of Polarity)

Price Above Bullish Gap (change Of Polarity)
price action BUY
Price Below Bearish Gap (change Of Polarity)
price action SELL

TrendLine

Price Above Bearish Trend Line
price action BUY
Price Above Bullish Trend Line
price action BUY
Price Pullback Bearish Trendline
price action BUY
Price Crosses Up Bearish Trend Line
price action BUY
Price Crosses Down Bullish Trend Line
price action SELL
Price Below Bullish Trend Line
price action SELL
Price Below Bearish Trend Line
price action SELL
Price Pullback Bullish Trendline
price action SELL

Channel

Price Crosses Up Bullish Channel
price action BUY
Price Above Bullish Channel
price action BUY
Price Pullback To Bullish Channel Upper Line
price action BUY
Price Near Bullish Channel Lower Line
price action BUY
Price Pullback To Bullish Channel Median Line
price action BUY
Price Crosses Up Bearish Channel
price action BUY
Price Above Bearish Channel
price action BUY
Price Pullback To Bearish Channel Upper Line
price action BUY
Price Near Bearish Channel Lower Line
price action BUY
Price Pullback To Bearish Channel Median Line
price action BUY
Price Crosses Down Bullish Channel
price action SELL
Price Below Bullish Channel
price action SELL
Price Pullback To Bullish Channel Lower Line
price action SELL
Price Near Bullish Channel Upper Line
price action SELL
Price Pullback To Bullish Channel Median Line
price action SELL
Price Crosses Down Bearish Channel
price action SELL
Price Below Bearish Channel
price action SELL
Price Pullback To Bearish Channel Lower Line
price action SELL
Price Near Bearish Channel Upper Line
price action SELL
Price Pullback To Bearish Channel Median Line
price action SELL

Triangle

Price Crosses Up Ascending Triangle
price action BUY
Price Is Near Ascending Triangle Lower Line
price action BUY
Price Above Ascending Triangle
price action BUY
Price Pullback From Above Ascending Triangle
price action BUY
Price Crosses Up Descending Triangle
price action BUY
Price Is Near Descending Triangle Lower Line
price action BUY
Price Above Descending Triangle
price action BUY
Price Pullback From Above Descending Triangle
price action BUY
Price Crosses Up Symmetric Triangle
price action BUY
Price Is Near Symmetric Triangle Lower Line
price action BUY
Price Above Symmetric Triangle
price action BUY
Price Pullback From Above Symmetric Triangle
price action BUY
Price Crosses Down Ascending Triangle
price action SELL
Price Is Near Ascending Triangle Upper Line
price action SELL
Price Below Ascending Triangle
price action SELL
Price Pullback From Below Ascending Triangle
price action SELL
Price Crosses Down Descending Triangle
price action SELL
Price Is Near Descending Triangle Upper Line
price action SELL
Price Below Descending Triangle
price action SELL
Price Pullback From Below Descending Triangle
price action SELL
Price Crosses Down Symmetric Triangle
price action SELL
Price Is Near Symmetric Triangle Upper Line
price action SELL
Price Below Symmetric Triangle
price action SELL
Price Pullback From Below Symmetric Triangle
price action SELL

Wedge

Price Crosses Up Rising Wedge
price action BUY
Price Is Near Rising Wedge Lower Line
price action BUY
Price Above Rising Wedge
price action BUY
Price Pullback From Above Rising Wedge
price action BUY
Price Crosses Up Falling Wedge
price action BUY
Price Is Near Falling Wedge Lower Line
price action BUY
Price Above Falling Wedge
price action BUY
Price Pullback From Above Falling Wedge
price action BUY
Price Crosses Down Rising Wedge
price action SELL
Price Is Near Rising Wedge Upper Line
price action SELL
Price Below Rising Wedge
price action SELL
Price Pullback From Below Rising Wedge
price action SELL
Price Crosses Down Falling Wedge
price action SELL
Price Is Near Falling Wedge Upper Line
price action SELL
Price Below Falling Wedge
price action SELL
Price Pullback From Below Falling Wedge
price action SELL

Trend Change

Bearish Trend Change To Bullish Trend With A Higher Low
price action BUY
Bearish Trend Change To Bullish Trend With A Higher Low And Higher High
price action BUY
Bullish Trend Change To Bearish Trend With A Lower High
price action SELL
Bullish Trend Change To Bearish Trend With A Lower High And Lower Low
price action SELL

RSI14-TrendLine

Rsi Crosses Up Bearish Trendline
oscillator BUY
Rsi Above Bearish Trendline
oscillator BUY
Rsi Above Bullish Trendline
oscillator BUY
Rsi Crosses Down Bullish Trendline
oscillator SELL
Rsi Below Bullish Trendline
oscillator SELL
Rsi Below Bearish Trendline
oscillator SELL

MACD

Macd Crosses Up Signal
oscillator BUY
Macd Crosses Up 0
oscillator BUY
Signal Crosses Up 0
oscillator BUY
Macd Above Signal
oscillator BUY
Macd Crosses Down Signal
oscillator SELL
Macd Crosses Down 0
oscillator SELL
Signal Crosses Down 0
oscillator SELL
Macd Below Signal
oscillator SELL

RSI14

Rsi14 Crosses Up 30
oscillator BUY
Rsi14 Crosses Up 50
oscillator BUY
Rsi14 Below 30
oscillator BUY
Rsi14 Crosses Down 70
oscillator SELL
Rsi14 Crosses Down 50
oscillator SELL
Rsi14 Above 70
oscillator SELL

RSI14 Crossover SMA14

Rsi14 Crosses Up Sma14
oscillator BUY
Rsi14 Above Sma14
oscillator BUY
Rsi14 Crosses Down Sma14
oscillator SELL
Rsi14 Below Sma14
oscillator SELL

RSI Divergence

Rsi Regular Bullish Divergence
oscillator BUY
Rsi Regular Bullish Divergence 2 Steps
oscillator BUY
Rsi Hidden Bullish Divergence 2 Steps
oscillator BUY
Rsi Regular Bearish Divergence
oscillator SELL
Rsi Regular Bearish Divergence 2 Steps
oscillator SELL
Rsi Hidden Bearish Divergence 2 Steps
oscillator SELL

MACD Divergence

Macd Regular Bullish Divergence
oscillator BUY
Macd Hidden Bullish Divergence
oscillator BUY
Macd Regular Bullish Divergence
oscillator BUY
Macd Hidden Bullish Divergence
oscillator BUY
Macd Regular Bearish Divergence
oscillator SELL
Macd Hidden Bearish Divergence
oscillator SELL
Macd Regular Bearish Divergence
oscillator SELL
Macd Hidden Bearish Divergence
oscillator SELL

Volume

Volume Crosses Up MA10
oscillator BUY
Volume Above MA10
oscillator BUY
Volume Crosses Up MA20
oscillator BUY
Volume Above MA20
oscillator BUY
Volume Crosses Up MA50
oscillator BUY
Volume Above Up MA50
oscillator BUY
Volume Crosses Up MA10
oscillator SELL
Volume Above MA10
oscillator SELL
Volume Crosses Up MA20
oscillator SELL
Volume Above MA20
oscillator SELL
Volume Crosses Up MA50
oscillator SELL
Volume Above Up MA50
oscillator SELL

Fibonacci Retracement

Fibonacci Retracement 38.2%
price ratio BUY
Fibonacci Retracement 50%
price ratio BUY
Fibonacci Retracement 61.8%
price ratio BUY
Fibonacci Retracement 78.6%
price ratio BUY
Fibonacci Retracement 38.2%
price ratio SELL
Fibonacci Retracement 50%
price ratio SELL
Fibonacci Retracement 61.8%
price ratio SELL
Fibonacci Retracement 78.6%
price ratio SELL

Fibonacci Extension

Fibonacci Extension 100%
price ratio BUY
Fibonacci Extension 127.2%
price ratio BUY
Fibonacci Extension 141.4%
price ratio BUY
Fibonacci Extension 161.8%
price ratio BUY
Fibonacci Extension 200%
price ratio BUY
Fibonacci Extension 227.2%
price ratio BUY
Fibonacci Extension 241.4%
price ratio BUY
Fibonacci Extension 261.8%
price ratio BUY
Fibonacci Extension 100%
price ratio SELL
Fibonacci Extension 127.2%
price ratio SELL
Fibonacci Extension 141.4%
price ratio SELL
Fibonacci Extension 161.8%
price ratio SELL
Fibonacci Extension 200%
price ratio SELL
Fibonacci Extension 227.2%
price ratio SELL
Fibonacci Extension 241.4%
price ratio SELL
Fibonacci Extension 261.8%
price ratio SELL

Harmonic ABCD Patterns

Bullish ABCD Pattern
price ratio BUY
Bearish ABCD Pattern
price ratio SELL

Harmonic XABCD Patterns

Bullish Gartly
price ratio BUY
Bullish Crab
price ratio BUY
Bullish Deep Crab
price ratio BUY
Bullish Butterfly
price ratio BUY
Bullish Bat
price ratio BUY
Bullish Alternative Bat
price ratio BUY
Bullish Cypher
price ratio BUY
Bullish Nen Star
price ratio BUY
Bullish Shark
price ratio BUY
White Swan
price ratio BUY
Bearish Gartly
price ratio SELL
Bearish Crab
price ratio SELL
Bearish Deep Crab
price ratio SELL
Bearish Butterfly
price ratio SELL
Bearish Bat
price ratio SELL
Bearish Alternative Bat
price ratio SELL
Bearish Cypher
price ratio SELL
Bearish Nen Star
price ratio SELL
Bearish Shark
price ratio SELL
Black Swan
price ratio SELL

Harmonic Three Drives Patterns

Bullish Three Drives Pattern
price ratio BUY
Bearish Three Drives Pattern
price ratio SELL

Order Block

Bullish Order Block (pivot Base)
ICT BUY
Bullish Order Block (price Node)
ICT BUY
Bullish Order Block Combined With Momentum
ICT BUY
Bearish Order Block (pivot Base)
ICT SELL
Bearish Order Block (price Node)
ICT SELL
Bearish Order Block Combined With Momentum
ICT SELL

Pricing Plans

Pay As You Earn!

50USDT/Month

Free Trial

10 Days Free Trial

All Active Markets

More Than 300 Strategies

More Than 1500 Currencies

10 Timeframes

Static Strategy Makings

Dynamic Strategy Makings

Free Trial

1NXC/Hour

Free Trial

10 Days Free Trial

All Active Markets

More Than 300 Strategies

More Than 1500 Currencies

10 Timeframes

Static Strategy Makings

Dynamic Strategy Makings

Free Trial

$50/Month

Free Trial

10 Days Free Trial

All Active Markets

More Than 300 Strategies

More Than 1500 Currencies

10 Timeframes

Static Strategy Makings

Dynamic Strategy Makings

Free Trial

What Is NXC Token?

NXC tokens exist as digital tokens built on leading blockchains, including Ethereum, Binance Smart Chain. These transport protocols consist of open source software that interface with blockchains to allow for the issuance and redemption of NXC tokens. NXC token used for interaction with Nexcrypto trading assistant system. To use the system hourly, You need to pay NXC coin and you can earn NXC coin through the system if you gain credits by reporting your own trades base on Nexcrypto Analysis and share it with other users. NXC could be issued from UniSwap or PanCake Swap.

Contact Us

Any question or remarks? Just write us a message!

Contact Infromation

Fill up the form and our Team will get back to you within 24 hours.